Reliability of information

Management’s Discussion and Analysis (MD&A) is prepared by management to lend qualitative context to the financial statements, and to provide a complete and balanced account of Telefilm’s past performance and future outlook. Content is factual and based on meaningful, relevant and reliable information.

Management has implemented:

  • A comprehensive control environment to ensure the effectiveness of systems
  • Quality control procedures that ensure completeness, reliability, comparability and relevance of financial disclosures

This MD&A has been presented to the Management Committee, to the Executive Director, to the Audit and Finance Committee, and finally to the Board of Directors for approval.

Financial Statements along with the Auditor’s Report.

New accounting standards

On April 1, 2009, Telefilm adopted the following standards and amendments as set out in the Canadian Institute of Chartered Accountants (CICA) Accounting Handbook:

  • 3064 - Goodwill and Intangible Assets
  • 3855 - Financial Instruments — Recognition and Measurement
  • 3862 - Financial Instruments — Disclosures

The application of these new standards did not affect Telefilm’s financial results in any way.

Accounting estimates

In preparing financial information, management has used its best estimates and assumptions that could have a material impact on amounts reported. Significant accounting estimates are discussed in Note 2—Significant Accounting Policies of the Financial Statements.

Financial reporting standards

According to the new CICA applicable accounting standards, Telefilm belongs to the category “other government organizations”. Management has therefore analyzed the impacts of both the International Financial Reporting Standards (IFRS) and the Public Sector Accounting Standards, along with the needs and objectives of its financial statement users. Following the analysis, Telefilm has chosen to adopt the Public Sector Accounting Standards. These standards will be applicable to the fiscal year beginning April 1, 2011.

Financial review at a glance

  • Fiscal 2009-2010 was positive despite a net result of $-5.9M. The result demonstrates that Telefilm, a funding organization, disbursed its current program funding and reinvested its accumulated recoveries.
  • Overall assistance expenses went from $113.7M to $115.3M—an increase of $1.6M over the previous fiscal year. This increase is attributable to CFFF expenses.
  • Recoveries are lower this year by almost $4M, a 30% decrease from 2008-2009. This is due mainly to lower return on investments from the reported revenues on Canadian films. A drop in sales from the financed Canadian films has also negatively affected the Canadian distributors’ performance.
  • Operating and administrative expenses decreased by 7%, which demonstrates Telefilm’s tight control over these expenses.
  • Funding dropped by $4M compared to 2008-2009, mainly due to Telefilm-administered programs funded through parliamentary appropriation that were shut down ($-3M) and by a reduction in the CNMF funding utilization ($-1M).

Cost of operations: $134.9M

Cost of operations: $134.9M

Government funding & revenues: $129.0M

Government funding & revenues: $129.0M

Analysis of expenses

Assistance Expenses

Assistance expenses are program expenses incurred mainly to fund clients.

Canada Feature Film Fund

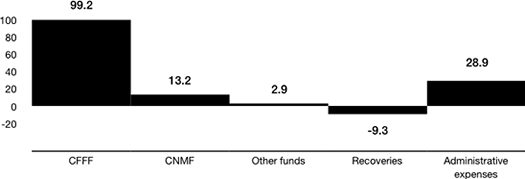
In 2009-2010, CFFF assistance expenses reached the highest levels in the history of the Fund ($99.2M), an increase of $4.7M over 2008-2009. That increase is due mainly to greater emphasis on the production and marketing assistance program within the CFFF. The available funds committed on a yearly basis are known in advance, and Telefilm expects a pullback in assistance expenses to 2008-2009 levels for 2010-2011. More detail of CFFF expenses is disclosed in Schedule A of the Financial Statements.

Assistance expenses for CFFF ($M)

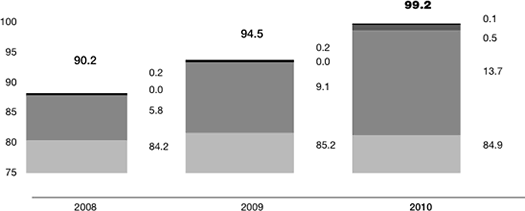
About 86% of the $99.2M of funding in 2009-2010 was appropriated from parliament. Recoveries from investments and forgivable advances make up most of the remainder.

Funding sources for CFFF ($M)
  • Others
  • APTN
  • Recoveries
  • Parliamentary appropriation
Funding sources for CFFF ($M)

Recoveries utilization is up by $4.6M compared to last year. This represents an important funding source for Telefilm since amounts recovered from earlier investments enable a greater number of projects to be funded.

Since the level of parliamentary appropriation is stable, the utilization of recoveries, whether they are coming from actual or previous fiscal, is subject to the levels of assistance expenses resulting in a higher utilization of recoveries in CFFF assistance.

However, total annual recoveries took a plunge in 2009-2010 from $11.9M to $8.5M. Two factors influence annual recoveries: domestic and international sales. For this fiscal year, only two films financed by Telefilm were successful enough in domestic sales to generate significant return on investment. In addition, unlike 2008-2009, no films reported significant recoveries on international sales.

Telefilm follows its recoveries closely to ensure that annual projections are realistic. The existence of a trend is not conclusive and recoveries are forecast to be up slightly to $10M for 2010-2011. The situation may warrant a mid-year review by management.

Recoveries for CFFF ($M)

Canada New Media Fund

After 12 years of administration by Telefilm, the CNMF, in its various forms, was wound up this fiscal year. The Department of Canadian Heritage (PCH) has not renewed the Contribution Agreement for the next fiscal year in its current form. For 2010-2011 and beyond, this federal assistance to the new media industry will be delivered through the Canada Media Fund (CMF). The related Programs funding will be administered by Telefilm through a Services Agreement with the CMF.

Assistance expenses for CNMF ($M)

In its final year, CNMF assistance expenses stayed relatively stable at $13.2M. PCH funded 86% of the CNMF assistance expenses ($11.4M) through a Contribution Agreement. Accumulated recoveries from the previous fiscal years ($1.8M) completed the assistance expenses funding.

Funding sources for CNMF ($M)

  • Parliamentary appropriation
  • Recoveries
  • PCH
Funding sources for CNMF ($M)

Under the Contribution Agreement, Telefilm has been obligated to remit all fund-related recoveries to the Consolidated Revenue Fund of Canada since fiscal 2007-2008. Telefilm was able to remit slightly more than $0.5M for fiscal 2009-2010.

Operating and Administrative Expenses

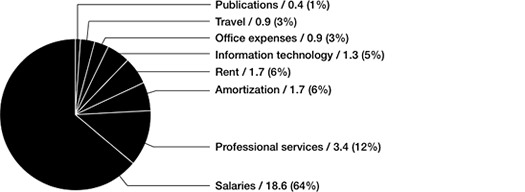
The following pie chart outlines the amounts and percentages of Telefilm’s operating and administrative expenses by financial statement line item. More detail about operating and administrative expenses is disclosed in Schedule D of the Financial Statements.

Operating and administrative expenses: $28.9M

Operating and administrative expenses: $28.9M

Telefilm closely monitors its budget capacity and the necessity of its expenses. Overall operating and administrative expenses were down 7% in 2009-2010, from $31.1M to $28.9M.

Operating and administrative expenses are incurred to deliver CFFF programs and activities, to fulfill the Services Agreement signed with the CTF for the delivery of its program funding, for CNMF programs, and for corporate responsibilities such as governance.

Telefilm’s control over its expenses is evident—decreases in costs outnumber and outweigh increases. The most important cost saving came from professional services which dropped $1.8M over last year. This is mainly due to a significant accrued charge recorded in 2008-2009 that was resolved this fiscal year.

Operating and administrative expenses $-2.2M Variances 2009-2010 vs 2008-2009

Operating and administrative expenses $-2.2M Variances 2009-2010 vs 2008-2009

Government Funding and Revenues

Telefilm has three main sources of funding: parliamentary appropriation, CNMF Contribution Agreement, and CTF management fees related to a Services Agreement.

Parliamentary appropriation fell $3.2M in 2009-2010 mainly due to the termination of the National Training School Program ($2.5M) and the Interdepartmental Partnership with Official-Language Communities Program ($0.6M). Parliamentary appropriation is expected to pull back slightly to $105.4M for fiscal year 2010-2011.

CNMF revenues from the Contribution Agreement decreased by $1M to $13M. This reduction is due to the closing of the fund and Telefilm’s requirement to reinvest its accumulated recoveries. No Contribution Agreement revenue will come from the CNMF next year.

CTF management fees are up slightly by $0.2M to $7.9M. Telefilm has also been mandated on behalf of the Canada Media Fund (CMF) to deliver its new programs, and related management fees are expected to be close to $10M for next fiscal year.

Parliamentary appropriation ($M)
Other important funding sources: $21.4M
  • CNMF (PCH) 13.0
  • CTF management fees 7.9
  • APTN 0.5
  • PCH (Professional training shcools) 0.0
Other important funding sources: $21.4M

Net result: revenue vs expense

  • Net result is $-5.9M, a decrease of $7.3M from 2008-2009.
  • This result is favorable for Telefilm, because deficits are related to program activities. It shows that Telefilm is using its entire program funding while also reinvesting accumulated recoveries.
  • All funds, CFFF, CNMF and Other funds, have used accumulated recoveries in the funding of their expenses, creating a suitable deficit situation for 2009-2010.

Net results: $-5.9M

Net results: $-5.9M

The net result is largely attributable to the CFFF, which used accumulated recoveries of $5.2M in this fiscal. These recoveries were recorded in previous fiscal years.

As well, the CNMF used its accumulated recoveries in its last year of operation and fulfilled the shortfall of $-1.8M over the PCH Contribution Agreement funding.

The administrative surplus is mostly related to an estimated accrued charge that was recorded for accounting purposes last fiscal year but was settled and funded this fiscal year due to its unknown final amount. Notwithstanding, the best way for Telefilm to assess the performance of the administrative result is a calculation using the “modified cash basis” method rather than looking at the accrual accounting method. This matter is discussed further in Section: A Responsible Administrator.

A deficit position by fund is normal to Telefilm business, since Telefilm reinvests its recoveries while the production cycles of its projects do not synchronize with its fiscal year.

Balance sheet

Highlights of key items on the balance sheet and main changes from last year are addressed in this section. The balance sheet itself, along with comparative figures, is presented in the Financial Statements.

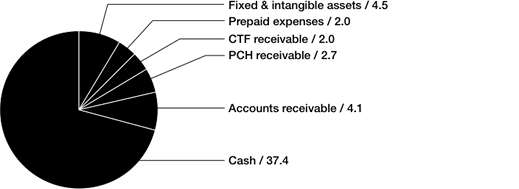
Assets: $52.7M
Assets: $52.7M

The most important item on the balance sheet is the amount receivable from Canada (the equivalent of Telefilm’s cash), which accounted for 71% of total assets in 2009-2010. This cash position will fund the contractual commitments of all programs ($31.3M), as well as some future projects (see Note 10a in the Financial Statement notes). Cash is managed by the Receiver General through the Consolidated Revenue Fund of Canada, and Telefilm does not receive any investment income.

In general, all receivables are expected to be recovered shortly. Both PCH and CTF receivables are due according to agreements. The $4.1M accounts receivable item is presented net of allowance for bad debts of $1.2M.

The net value of fixed and intangible assets amounts to $4.5M, and represents the remaining value of the assets required for Telefilm operations to be amortized over the coming years.

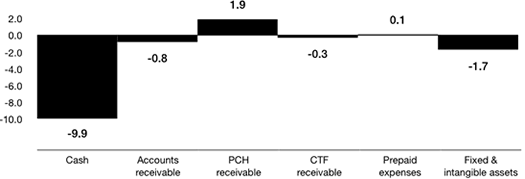
Assets variances: $-10.7M 2009-2010 vs 2008-2009

Assets have decreased by $10.7M since last fiscal year, and there are three major reasons why:

  1. Cash decreased significantly from last year’s position ($-9.9M). The section Cash flow provides details about why this has occurred.
  2. Another important change in Telefilm’s assets comes from the PCH receivable ($1.9M), which is fully recoverable and related to activities for CNMF assistance expenses that were not yet repaid.
  3. The $-1.7M variance for fixed and intangible assets is normal and related to straight-line amortization.
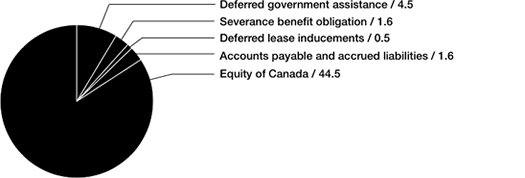
Liabilities and equity: $52.7M

At $44.5M, the equity of Canada represents 84% of the overall liabilities and equity. It mostly reflects, on an accrual accounting basis, the recoveries that have not yet been reinvested as assistance expenses.

Deferred government assistance is the largest liability on the balance sheet and represents the unamortized amount used to fund the fixed and intangible assets ($4.5M).

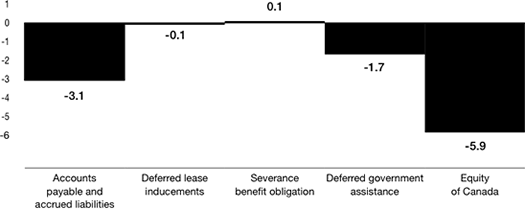
Liabilities and equity $-10.7M variances 2009-2010 vs 2008-2009

Year-over-year variances on the liabilities and equity of Canada come from three main sources:

  1. The decreases in accounts payable ($-3.1M) are mostly related to a 2008-2009 material accrued expense that has been settled and to lower than usual trade payables on projects and accrued salaries.
  2. Deferred government assistance ($-1.7M) is directly related to the amortization of fixed and intangible assets. This decrease reflects the funding used in line with the assets’ utilization.
  3. The equity decrease ($-5.9M) is principally attributable to shortfalls in funding with regard to programs (see section Net Result). This deficit is temporary as it is replenished by accumulated recoveries from previous years.

Cash flow

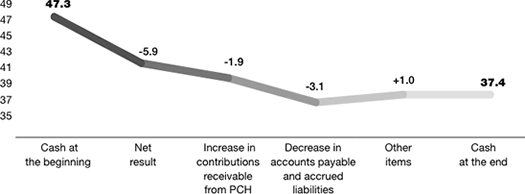
Telefilm uses the indirect method to disclose its cash flows activities. Cash on hand decreased significantly by $9.9M in 2009-2010 to $37.4M.

Three main issues affected overall cash flows:

  1. The net result for the year ($-5.9M)
  2. The increase in the PCH receivable related to the CNMF program activities ($-1.9M)
  3. The decrease in accounts payable compared to last year ($-3.1M)

Other items contributed $1M to cash flows, but were less significant for reporting purposes.

2009-2010 Cash flows activities: $-9.9M

Outlook

The future is always exciting for Telefilm and next year will present a new round of challenges.

Corporate Plan

In 2010-2011 Telefilm will establish a new corporate plan that will chart a course for the organization for future years. It will follow Telefilm’s former Corporate Plan 2006-2007 to 2010-2011
From cinemas to cell phones: Telefilm Canada responds to the multiplatform challenge.

This new corporate plan will integrate key strategic issues based on assessments of previous performance, analysis of the external environment, and an examination of Telefilm’s resources. Furthermore, the new plan will identify objectives to achieve and propose strategies with related performance measures.

The new plan should be approved and implemented for the 2011-2012 fiscal year.

CICA Public Sector Accounting Handbook

As mentioned, Telefilm has determined that the CICA Public Sector Accounting Standards are the most appropriate basis of accounting for users of its financial statements. For 2010-2011, management will need to record all business transactions on two standards: CICA Accounting Standards for Private Enterprises for its 2010-2011 financial statements, and on CICA Public Sector Accounting Standards for its 2010-2011 comparative figures pertaining to 2011-2012 financial statements disclosure.

Certification Regime for Crown Corporations

For next fiscal year, Telefilm intends to gradually apply a certification regime to its activities. As part of this project, the organization will need to define its certification regime strategy as well as the scope and the area of its certification, and update its risk assessment and the assessment of its key control activities. Management might expect entity-level controls to come under scrutiny, such as important business processes, general IT control processes, and financial statement closing and reporting processes.

Quarterly Financial Reports for Crown Corporations

An amendment to the Financial Administration Act has established standards on quarterly financial reports for Crown corporations. Reports will need to be made public within 60 days after the fiscal quarter. Over the next year, Telefilm will need to review its financial reporting in order to comply with this new requirement, which comes into effect April 1, 2011.

Budget 2010 Cost Containment Measures for Crown Corporations

Telefilm’s operating budgets from parliamentary appropriation will be frozen for the fiscal years 2011-2012 and 2012-2013. Any shortfalls will need to be funded through sources other than parliamentary appropriation.

The Treasury Board sent all Crown Corporations directives limiting overall operating expenditures for the upcoming years.

Telefilm has started a review of its operating expenditures in order to identify measures ensuring that the Corporation will implement the spirit and the intent of the guiding principle.

Overview of the last eight years

Statement of Operations and Comprehensive Income                
In thousands of dollars 2010 2009 2008 2007 2006 2005 2004 2003
                 
Assistance Expenses                
Canada Feature Film Fund 99,211 94,476 90,179 96,096 74,573 79,304 91,875 78,866
Canada New Media Fund 13,189 13,314 10,100 13,356 12,445 8,608 9,737 8,469
Other funds 2,876 5,896 6,167 6,838 5,945 5,690 5,535 7,859
Canadian Television Fund– Equity Investment 2,170 21,930 107,673 109,890 110,043  114,206
Music Entrepreneur Program 5,389  8,797  4,355
Assistance expenses 115,276 113,686 108,616 138,220 200,636 208,881 225,987 213,755
Recoveries (9,252) (13,155) (15,019) * (27,268) * (26,214) * (24,764) * (19,823) * (22,392) *
Operating and administrative expenses 28,905 31,119 28,402 * 28,066 * 23,996 * 23,788 * 22,413 * 21,614 *
Cost of operations 134,929 131,650 121,999 139,018 198,418 207,905 228,577 212,977
                 
Government Funding and Revenues                
Parliamentary appropriation 105,667 108,699 103,308 103,053 122,476 126,300 123,419 134,953
Management fees from the Canadian Television Fund 7,887 7,740 7,699 7,544
Contribution from the Canadian Television Fund 192 1,073 6,930 13,082 2,000 24,509 26,761
Department of Canadian Heritage:                
   Canadian Television Fund – Equity Investment Program 49,775 49,775 49,775  47,275
   Canada New Media Fund 13,000 13,970 11,500 14,000 14,000 8,907 9,656 7,452
   Music Entrepreneur Program 175 5,443 9,560 5,740
   Professional training schools 2,519 2,516 2,550 2,550 2,550 2,795
   Other contributions 98 81 25 135
Amortization of deferred government assistance 1,708 2,016 2,626 2,540 2,241 2,182 1,961 1,498
Other revenues 652 364 591 654 933 671 441 909
  129,012 133,062 129,341 137,372 205,232 197,828 221,871 227,383
Net result from operations and comprehensive income (5,917) 1,412 7,342 (1,646) 6,814 (10,077) (6,706) 14,406
* Financial data prior to 2009 have not been restated to conform to the presentation format adopted in 2010, as the impact on the data is immaterial.
Balance Sheet                
In thousands of dollars 2010 2009 2008 2007 2006 2005 2004 2003
                 
Assets                
Receivable from Canada 37,391 47,279 37,365 24,348 35,238 14,783 8,854
Receivable:              
   Department of Canadian Heritage 2,663 725 5,571 6,210 4,656 18,502 30,664 15,381
   Canadian Television Fund 2,028 2,365 2,164
9,154

2,000
24,509
26,761
Accounts receivable, prepaid expenses and loans 6,065 6,737 8,162 7,283 7,500 6,771 8,289 10,108
Long-term accounts receivable, loans and investments 182 55 268 164 243 428
Property and equipment 2,995 3,688 4,409 * 8,741 9,135 8,991 9,194 6,714
Intangible assets 1,517 2,532 3,601 *
  52,659 63,326 61,454 55,791 56,797 51,211 72,899 68,246
Liabilities and Equity of Canada                
Payable to Canada 8,551
Accounts payable and accrued liabilities 1,535 4,573 2,290 3,247 2,072 3,639 6,544 6,388
Deferred lease inducements 503 646 791 943 1,167 1,183 1,322 1,292
Severance benefit obligation 1,620 1,481 1,369 1,208 1,125 914 727 585
Deferred government assistance 4,512 6,220 8,010 8,741 9,135 8,991 9,194 6,714
Equity of Canada 44,489 50,406 48,994 41,652 43,298 36,484 46,561 53,267
  52,659 63,326 61,454 55,791 56,797 51,211 72,899 68,246
* Only these financial data have been adjusted to conform to the presentation format adopted in 2009.
You are presently viewing the static version of the report. Click here to go to full version Close